How to Read a Hurricane Forecast Cone
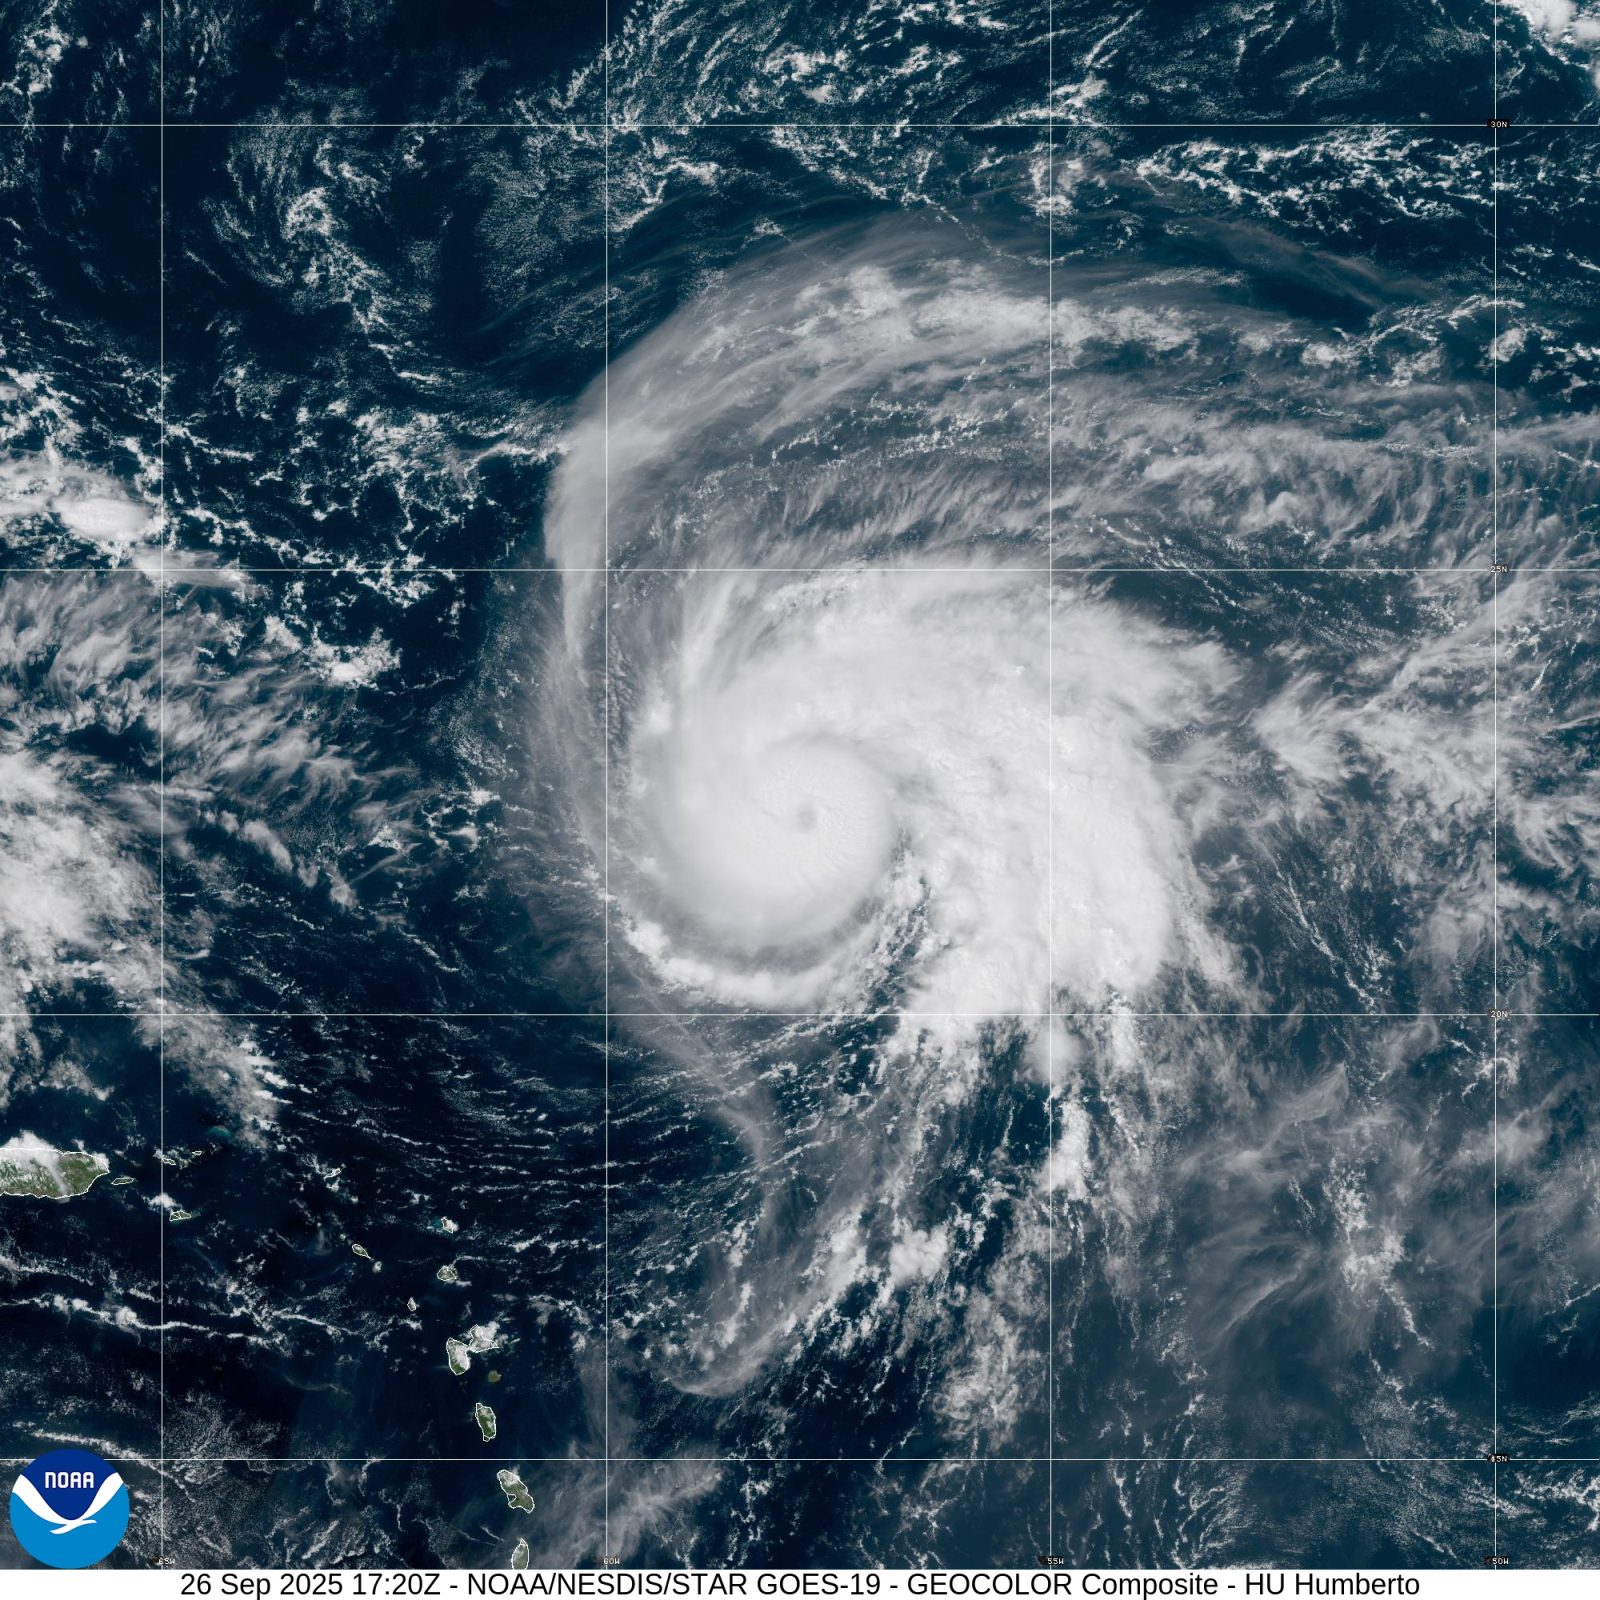
Direct answer: The hurricane forecast cone shows where the centre of the storm may go — nothing more. It is a picture of forecast uncertainty, built from how far past forecasts have missed, and it is not a map of the storm's size or of who will be hit. The entire five-day path of the centre stays inside the cone only about 60 to 70 percent of the time, so roughly a third of the time the centre travels outside it. If you read the cone as the danger zone, you will misunderstand it in both directions: places inside it may escape the worst, and places outside it can still be hit hard.
What the cone is
Every National Hurricane Center cone graphic carries the same explanation: NHC tropical cyclone forecast tracks can be in error, and the cone conveys that track forecast uncertainty. The solid white area shows the uncertainty for days 1 to 3 of the forecast, while the stippled area shows the uncertainty for days 4 to 5. The cone widens as it stretches forward because the further out the forecast goes, the less certain the centre's position becomes. The black line and dots show the NHC forecast track of the centre at the times indicated, and the orange circle marks the storm's current position.
How the cone is built
The cone is not drawn by hand around one storm. The NHC places imaginary circles along the forecast track at 12, 24, 36, 48, 72, 96 and 120 hours, and sizes each circle so that it encloses 67 percent of the previous five years of official forecast errors at that lead time. The cone is then formed by smoothly connecting the area swept out by those circles. That is why the cone looks similar for every storm: it reflects the average accuracy of forecasting in general, not the difficulty of the particular storm in front of you. As forecasts improve over the years, the cone narrows.
Reading the dots, letters and colours
Each dot on the track is a forecast position at a stated time, and the letter inside it gives the forecast intensity: D means a tropical depression, with wind speed less than 39 mph; S means a tropical storm, 39 to 73 mph; H means a hurricane, 74 to 110 mph; and M means a major hurricane, greater than 110 mph. A dot is black if the cyclone is forecast to stay tropical, and white with a black outline if it is forecast to become extratropical; an L on its own means the system is forecast to be a remnant low. The coloured areas show coastal areas under warnings and watches: hurricane warning in red, hurricane watch in pink, tropical storm warning in blue and tropical storm watch in yellow. Check the current outlook on our tropical outlook page and warnings on our weather alerts page.
Three mistakes to avoid
First, do not read the cone as the size of the storm. A hurricane's winds, rain and surge extend far beyond its centre, so the cone's width says nothing about how large the storm is. Second, do not treat the edge of the cone as the edge of danger: the centre itself escapes the cone roughly a third of the time, and impacts reach well outside it regardless. Third, do not fixate on the centre line. The line is the single most likely path, but the cone exists precisely because the centre may go anywhere inside it — and sometimes outside it. A town on the edge of the cone and a town on the centre line both need to watch the same warnings.
What to check instead
Use the cone for what it is: a guide to where the centre may go and how confident the forecast is. Then look at the rest of the same graphic — the watch and warning areas — and at your local forecast, which translates the national picture into what your county should expect. If local officials issue evacuation orders, follow them even if the centre line points somewhere else: evacuation decisions are made locally, and the cone alone never tells you whether to leave. For the wider hurricane plan, read our hurricane safety guide.
Frequently asked questions
What does the forecast cone actually show?
Only where the centre of the storm may go, with the uncertainty of the track forecast. It is built from circles sized to enclose 67 percent of the previous five years of forecast errors, and it is not a map of the storm's size or of who will be hit.
Why does the cone get wider further out?
Because track forecasts get less certain the further ahead they look. The solid white area covers days 1 to 3 and the stippled area covers days 4 to 5, and the circles at each forecast time grow with lead time.
What do the letters in the dots mean?
They give the forecast intensity at that time: D is a tropical depression (under 39 mph), S is a tropical storm (39 to 73 mph), H is a hurricane (74 to 110 mph) and M is a major hurricane (over 110 mph). A black dot means the system stays tropical; an L alone means a remnant low.
If my town is outside the cone, am I safe?
No. The entire five-day path of the centre stays inside the cone only about 60 to 70 percent of the time, so the centre itself travels outside it roughly a third of the time — and winds, rain and surge reach well beyond the centre in any case.
Sources
- National Hurricane Center - Forecast Cone Graphic (About this product)
- National Hurricane Center - Hurricane Lorenzo 2019 Forecast Graphics Archive
About the author
WND Editorial Team — The World Natural Disasters editorial team curates disaster information from official scientific and humanitarian sources, reviews safety guidance against public-agency recommendations, and maintains the historical database.
Written and reviewed under our editorial policy. Factual claims cite the sources listed above.
Found an error? See our corrections policy.